Decision Tree Induction
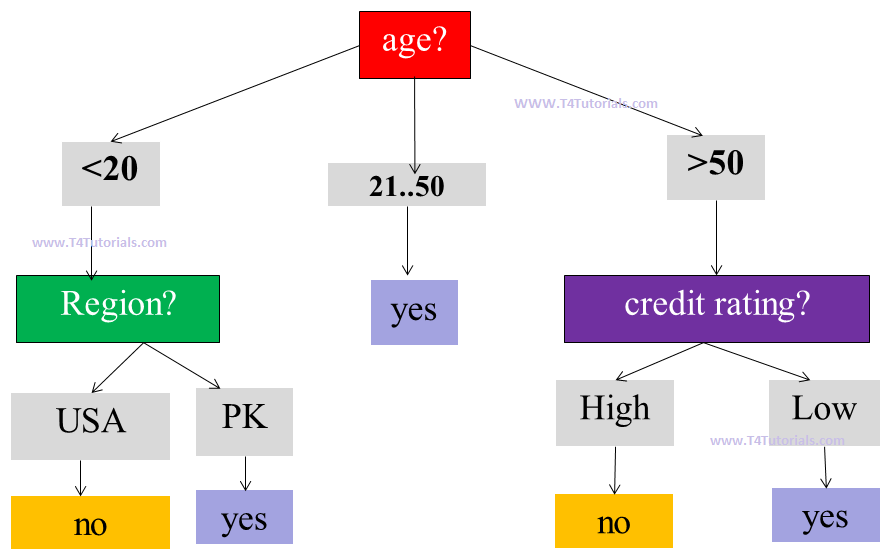
A decision tree is a tree-like structure and consists of following parts(discussed in Figure 1);
- Root node:
- age is the root node
- Branches:
- Following are the branches;
- <20
- 21…50
- >50
- USA
- PK
- High
- Low
- Following are the branches;
- Leaf node:
- Following are the leaf nodes;
- Yes
- No
- Following are the leaf nodes;

Entropy:
Entropy is a method to measure uncertainty.
- Entropy can be measured between 0 and 1.
- High entropy represents that data have more variance with each other.
- Low entropy represents that data have less variance with each other.
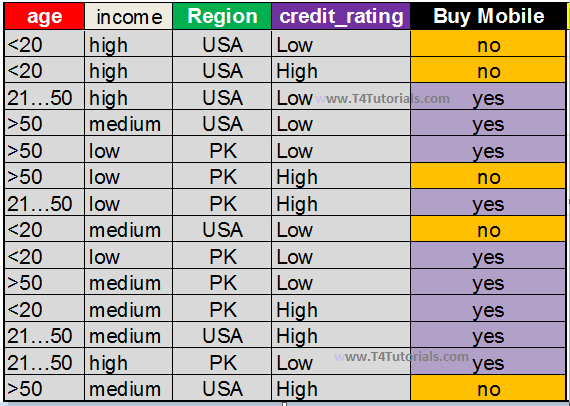
P = Total yes = 9
N = Total no = 5
Note that to calculate the log2 of a number, we can do the following procedure.
For example;
what is log2 of 0.642?
Ans: log (0.642) / log (2)
=–9/14 * log2(9/14) – 5/14 * log2 (5/14)
=-9/14 * log2(0.642) – 5/14 * log2 (0.357)
=-9/14 * (0.639) – 5/14 * (-1.485)
=0.941
[quads id=2]
For Age:
| age | Pi | Ni | Info(Pi, Ni) |
| <20 | 2 YES | 3 NO | 0.970 |
| 21…50 | 4 YES | 0 NO | 0 |
| >50 | 3 YES | 2 NO | 0.970 |
Note: if yes =2 and No=3 then entropy is 0.970 and it is same 0.970 if yes=3 and No=2
So here when we calculate the entropy for age<20, then there is no need to calculate the entropy for age >50 because the total number of Yes and No is same.
| The gain of Age | 0.248 | 0.248 is a greater value than income, Credit Rating, and Region. So Age will be considered as the root node. |
| Gain of Income | 0.029 | |
| Gain of Credit Rating | 0.048 | |
| Gain of Region | 0.151 |
[quads id=3]
Note that
- if yes and no are in the following sequence like (0, any number) or (any number, 0) then entropy is always 0.
- If yes and no are occurring in such a sequence (3,5) and (5, 3) then both have the same entropy.
- Entropy calculates the impurity or uncertainty of data.
- If the coin is fair (1/2, head and tail have equal probability, represent maximum uncertainty because it is difficult to guess that head occurs or tails occur) and suppose coin has the head on both sides then the probability is 1/1, and uncertainty or entropy is less.
- if p is equal to q then more uncertainty
- if p is not equal to q then less uncertainty
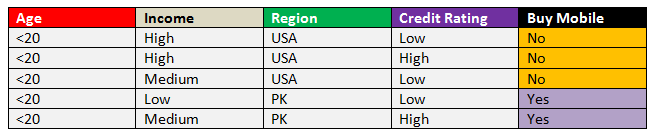
Now again calculate entropy for;
- Income
- Region
- Credit
For Income:
| Income | Pi | Ni | Info(Pi, Ni) |
| High | 0 YES | 2 NO | 0 |
| Medium | 1 YES | 1 NO | 1 |
| Low | 1 YES | 0 NO | 0 |
For Region:
| Region | Pi | Ni | Info(Pi, Ni) |
| USA | 0 YES | 3 NO | 0 |
| PK | 2 YES | 0 NO | 0 |
For Credit Rating:
| Credit Rating | Pi | Ni | Info(Pi, Ni) |
| Low | 1 YES | 2 NO | 0 |
| High | 1 YES | 1 NO | 0 |
[quads id=4]
| The gain of Region | 0.970 | 0.970 is a greater value than income, Credit Rating, and Region. So Age will be considered as the root node. |
| Gain of Credit Rating | 0.02 | |
| Gain of Income | 0.57 |
Similarly, you can calculate for all.
Next Similar Tutorials
- Decision tree induction on categorical attributes – Click Here
- Decision Tree Induction and Entropy in data mining – Click Here
- Overfitting of decision tree and tree pruning – Click Here
- Attribute selection Measures – Click Here
- Computing Information-Gain for Continuous-Valued Attributes in data mining – Click Here
- Gini index for binary variables – Click Here
- Bagging and Bootstrap in Data Mining, Machine Learning – Click Here
- Evaluation of a classifier by confusion matrix in data mining – Click Here
- Holdout method for evaluating a classifier in data mining – Click Here
- RainForest Algorithm / Framework – Click Here
- Boosting in data mining – Click Here
- Naive Bayes Classifier – Click Here