
What is the State transition Diagram?
When we write our program in Object-oriented programming, then we need to take classes and objects. Objects change their states during different functions/actions performed on objects.
In a state transition diagram, the states appear as rounded rectangles with the state names inside.
Symbols used in State Transition Diagram
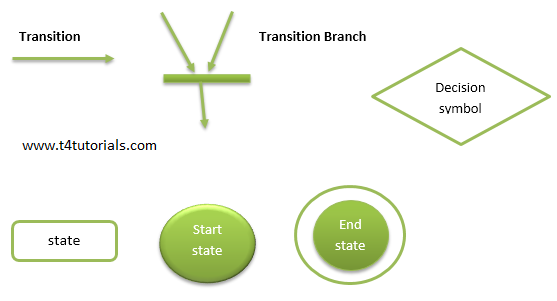
Terminologies of State Transition Diagram
State
In the state transition diagram, An object always remains in some state. Further, the state of the object may change after an event occur.
Event
Any activity that may trigger a state transition or can change the state.
Guard
In the state transition diagram, a guard is a boolean expression. Suppose if the guard is true, then it enables an event to trigger a transition.
Transition
The change of state within an object is represented with a transition. It is possible that an object changes its state when the transition occurs.
Action
One or more actions are taken by an object when the object changes a state.
Examples of State Transition Diagram
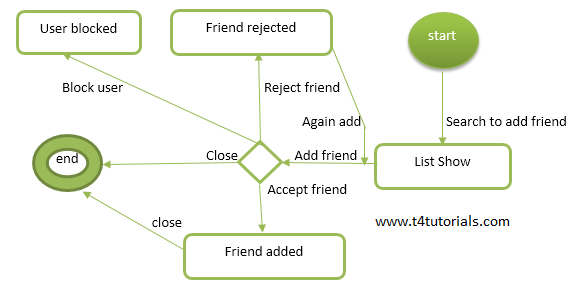
Case Study:
You need to develop a web-based application in such a way that users can search other users, and after getting search complete, the user can send the friend request to other users. If the request is accepted, then both users are added to the friend list of each other. If one user does not accept the friend request. The second user can send another friend request. The user can also block each other.
Solution:
- First of all, identify the object that you will create during the development of classes in oop
- Identify the actions or events
- Identify the possible states for an object
- Draw the diagram.
Object: friends
Events or actions: Search to add a friend, add a friend, accept a friend, reject a friend, again add, block user and close.
States: Start, the friend added, friend rejected, user blocked and end.
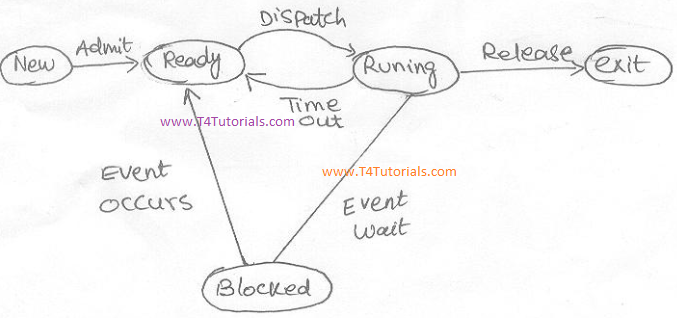
Example: Draw the state transition diagram of the OS process
List of UML tools for drawing the diagrams
Here, we are showing you a list of UML tools for drawing the diagrams.
| Tool | Publicly release (first time) | Open source/ Not open source | What Programming language they use? |
| Borland Together | – | Not an open source | – |
| Cacoo | October 2010 | Not an open source | HTML5 |
|
CaseComplete |
2004 | Not an open source | C# |
| ConceptDraw PRO | 1993 | Not an open source | – |
| Edraw Max | 2004 | Not an open source | C++ |
| Gliffy | 2006-08-01 | Not an open source | HTML5 and JavaScript |
| JDeveloper | – | Not an open source | Java |
| Lucidchart | 2008-12 | Not an open source | HTML5, JavaScript |
| Eclipse | 2007 | Open Source | Java |
| Dia | 2004? | Open Source | C |
| Magicraw | 1998 | Not an open source | Java |
| Microsoft isio | 1992 | Not an open source | – |
| PlantUML | 1999-04-30 | Open Source | Java |
| Microsoft Visual Studio | 1997-02 | Not an open source | C++, C# |
| Modelio | 2009 | Open Source | Java |
| MyEclipse | 2003 | Not an open source | Java |
| NetBeans | 1996 | Open Source | Java |
| Open ModelSphere | 2002-02 | Open Source | Java |
| Papyrus | 2013-06-27 | Open Source | Java |
| PragmaDev Studio | 2002 | Not an open source | Python, C, C++ |
| Prosa UML Modeller | 1996 | Not an open source | C/C++ |
| NClass | 2006-10-15 | Open Source | C# |
| PowerDesigner | 1989 | Not an open source | – |
| Rational Rhapsody | 1996 | Not an open source | C, C++, C#, Java, Ada |
| Rational Rose XDE | – | Not an open source | – |
| Rational Software Architect | Early 1990s | Not an open source | Java/C++ |
| Rational System Architect | – | Not an open source | – |
| Reactive Blocks | 2011-11-13 | Not an open source | Java |
| UModel | 2005-05 | Not an open source | Java, C#, Visual Basic |
| Rational Software Modeler | 2004-10-13 | Not an open source | – |
| PlantUML | 1999-04-30 | Open Source | Java |
| PlantUML | 1999-04-30 | Open Source | Java |
| Software Ideas Modeler | 2009-08-06 | Not an open source | C# |
| StarUML | 2005-11-01 | Not an open source | Delphi |
| Umbrello UML Modeller | 2006-09-09 | Open Source | C++, KDE |
| UML Designer | 2012 | Open Source | Java, Sirius |
| UMLet | 2005-11-05 | Open Source | Java |
| Umple | 2008 | Open Source | Umple, Java, PHP, Javascript |
| Visual Paradigm for UML | 2002-06-20 | Not an open source | C++, Java |
| yEd | – | Not an open source | Java |
Advantages of State Transition Diagram
- A state transition diagram is used to represent a finite state machine.
- A state transition diagram is a demonstration of how our objects and functions behave within the system.
When I can Use State Transition Diagram?
- When the system has some dependencies on the events or on the values in the past.
- State Transition diagram can be used when a software tester is testing the system for a finite set of input values.
- When the software tester focus is to understand the behavior of the object.
- When the software tester focus is to test the sequence of events that may occur in the system under test.
Frequently Asked Questions (FAQ)
In a state transition diagram, the circle at the right with a hollow border is the initial state.
True/False
Answer: False
In a state transition diagram, the circle to the left is the final state.
True/False
Answer: False
Topic Covered
State Transition Diagram with example in software engineering.
State Transition Diagram MCQs
Read More MCQs on UML Diagrams
- Deployment Diagram MCQs | UML
- Class diagram and object diagram MCQs | UML
- Use Case Diagram MCQs | UML
- Activity diagram MCQs
- Sequence diagrams MCQs
- UML diagrams solved MCQs UML
- Object-oriented analysis and design MCQs | UML
- Comparison of Use Case Diagram VS Class diagram
- Component Diagram MCQs
- State Transition Diagram MCQs